CrewTango for Windows and macOS records working time, apps used and websites visited. When enabled by your company, optional screenshots and keyboard and mouse activity can add context under clear rules.
The desktop app runs on Windows and macOS. Data scope depends on permissions and company settings.

The desktop app helps when time alone is not enough and you need context: apps, websites and activity levels.
Visibility into project time, apps, development tools and websites.
Working time, apps, websites and reports for administrative teams.
Context for work in financial systems and online tools.
Visibility into tools, portals and CRM usage.
Time analysis across CRMs, messaging apps and online tools.
Consistent computer work data without constant status requests.
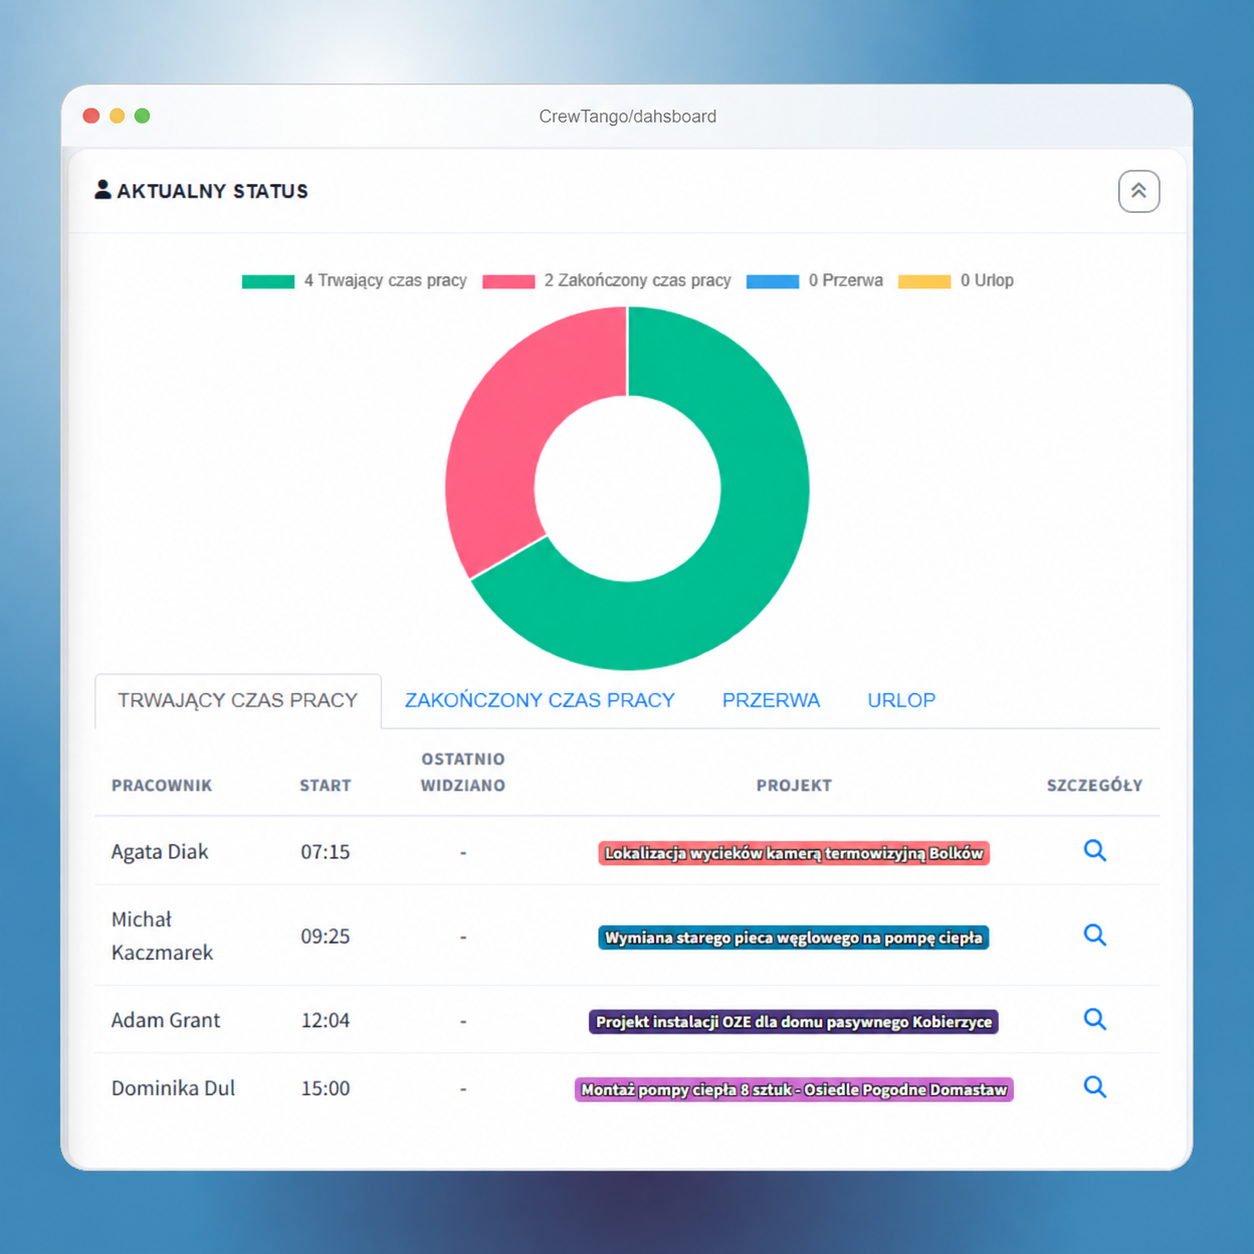
The desktop app sends computer work data to the browser dashboard, where managers see time, app and website reports and configured productivity categories.
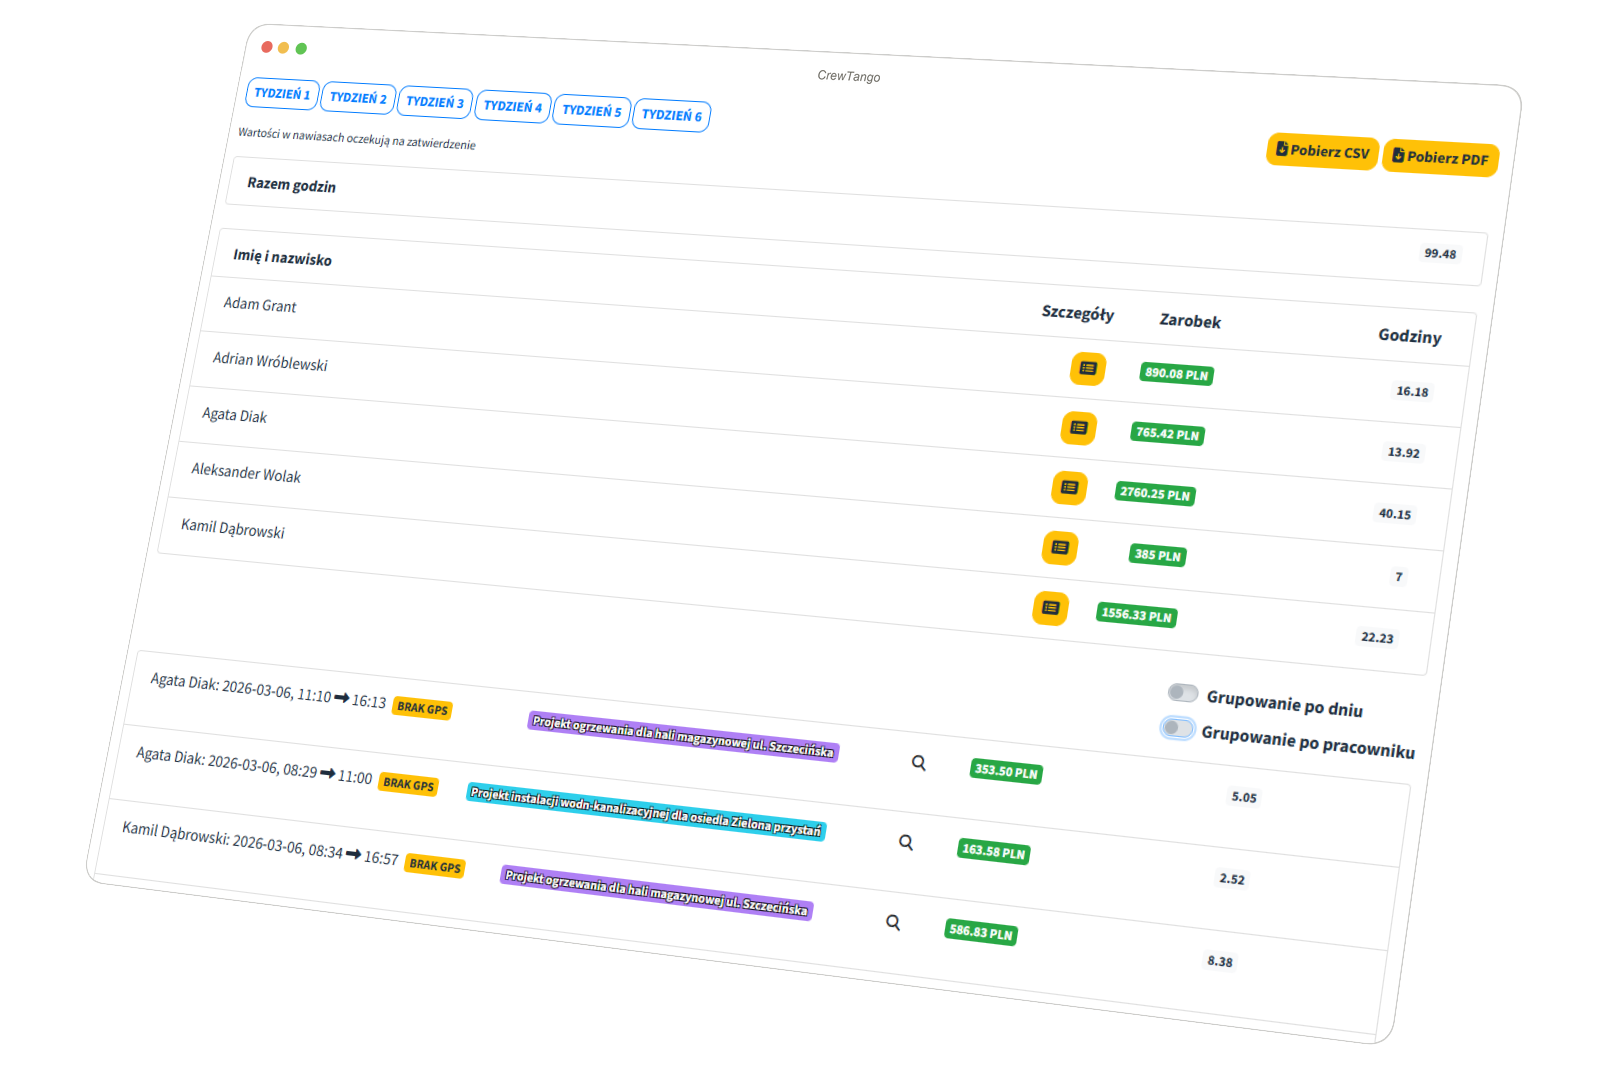
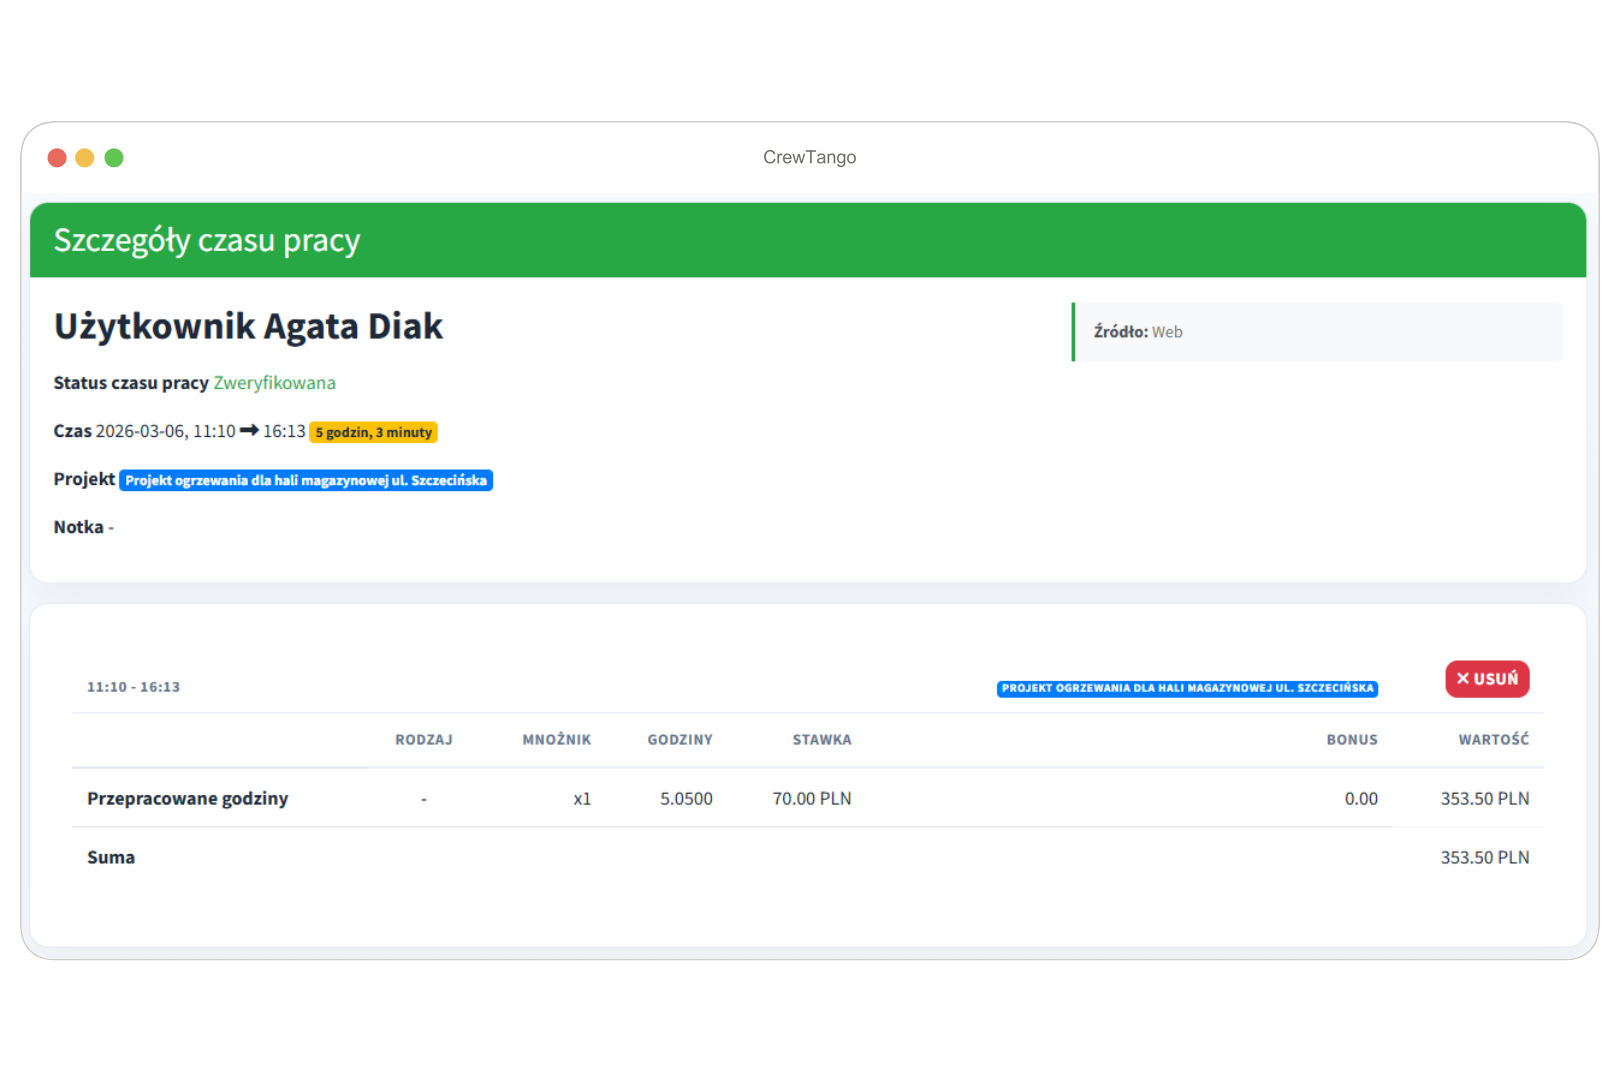
Desktop work sessions show starts, finishes, breaks, projects and total computer working time.
Start/Stop • Breaks • Projects

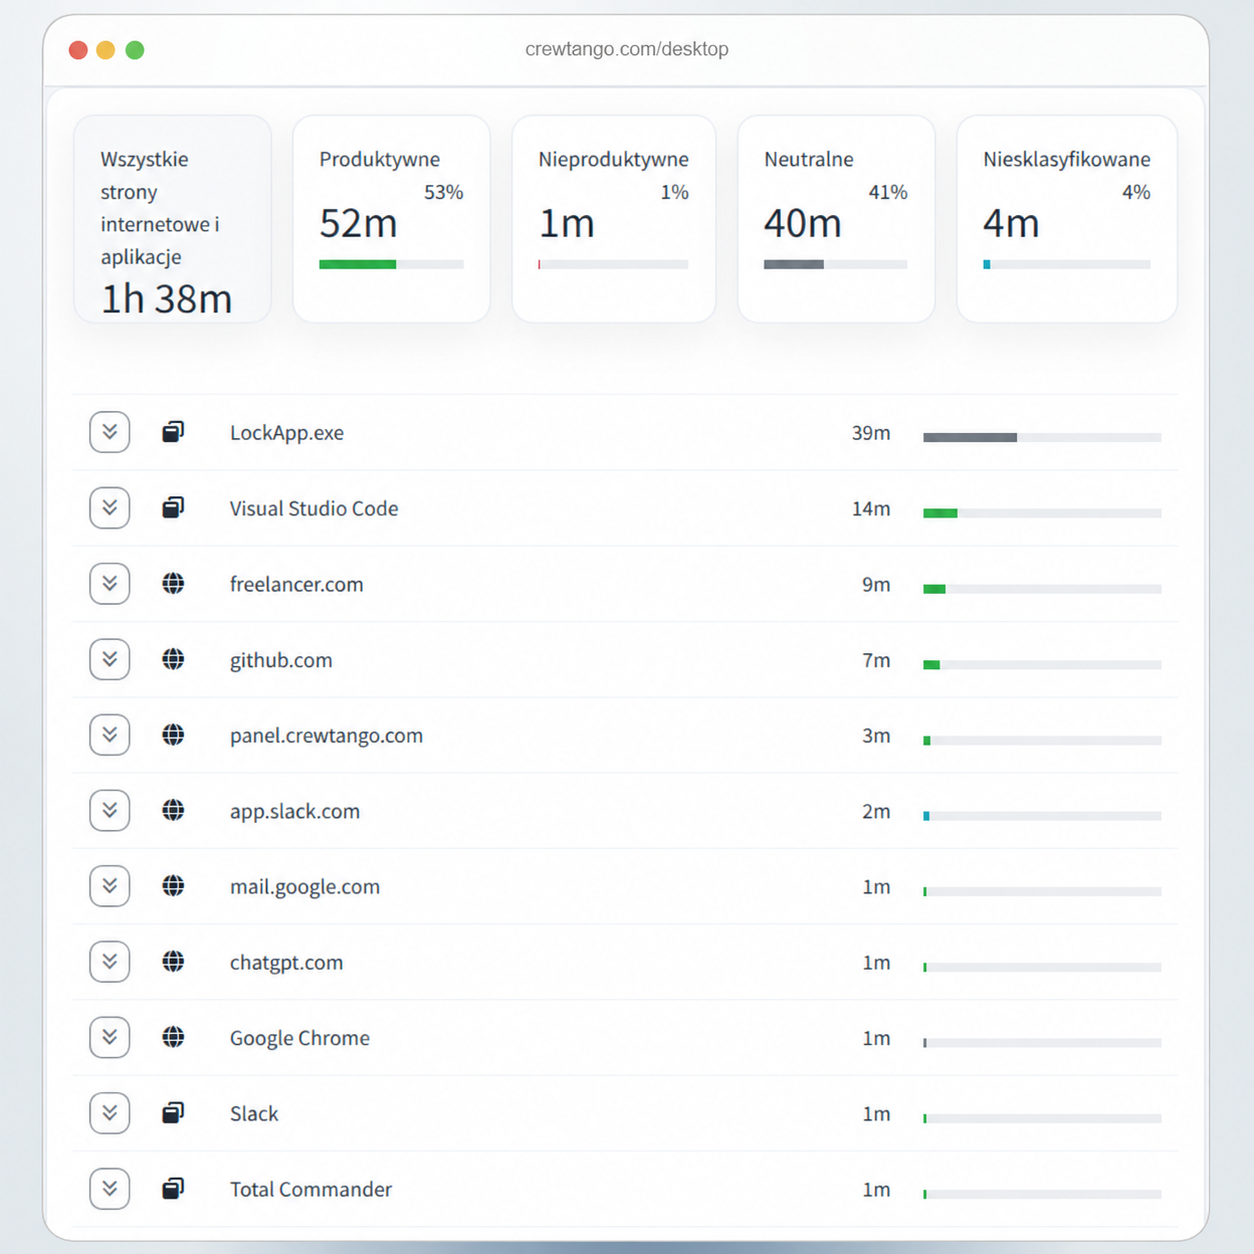
CrewTango records apps used and websites visited to give time reports context.
Apps • Websites • Categories

Capture screenshots according to company configuration, with optional blurring.
Scheduled • Optional blurring • Company rules

When enabled by the company, the dashboard can show aggregated keyboard and mouse usage statistics for a work session.
Optional • Company setting • Work session

Classify apps and websites as productive, neutral, unproductive or uncategorised.
Productive • Neutral • Unproductive

For employees using several displays, the system can group screenshots from multiple monitors.
Multiple monitors • Screenshots • Shared work session

Whether the team uses Windows or macOS, CrewTango records data consistently and displays it in one dashboard.
Working time, apps, websites and productivity categories. Screenshots and activity data are optional.
The same reporting process for Apple computer users, with data feeding the shared dashboard.
Contact us for the appropriate installer and rollout instructions for your organisation.

The desktop app follows company rules. Employees start work, the system collects configured data, and managers view summaries in the dashboard.
Employees start the Windows or macOS app and log into their accounts.
Working time reaches the dashboard with the desktop app identified as its source.
Apps and websites feed into the report. Screenshots and keyboard and mouse data are added when enabled.
App and website classifications are used in the productivity report.
The dashboard shows time, apps, websites and selected optional data.
Screenshots can add visual context to work session reports. Frequency, blurring and scope should follow clear company rules.


Screenshots are optional. Employers should clearly define how they are used.
Analyse app and website usage time and company-defined categories in the dashboard. The productivity report explains these records in the context of work. Optional activity statistics depend on company settings.
The desktop app should support work and reporting. Company policy should describe data scope, screenshots and report visibility.
Employees, managers and administrators can see different data.
Screenshot frequency should follow company policy.
Your company defines which apps and websites are productive.
The team should know when the app operates and what data appears in reports.
Get a clearer picture of computer work from recorded data.
| Area | Before | After introducing the app |
|---|---|---|
| Working time | Self-reported hours and manual entries | Desktop work sessions and ready-made summaries |
| Applications | Unclear where time went | List of apps used during the work session |
| Websites | Missing context for online work | Website addresses with productivity categories |
| Optional activity data | No comparable data | Aggregated keyboard and mouse statistics, when enabled |
| Productivity | Subjective assessment | Percentage based on company-defined categories |
Connect time, apps, websites and productivity in one dashboard. Screenshots and keyboard and mouse data remain optional settings.