USE CASE

Control project costs before the margin disappears

Extra tasks, rework and overtime use up the budget. CrewTango connects recorded time with rates and project plans so you can compare expectations with actual work as it happens.

Time by project Labour cost Time or cost budget
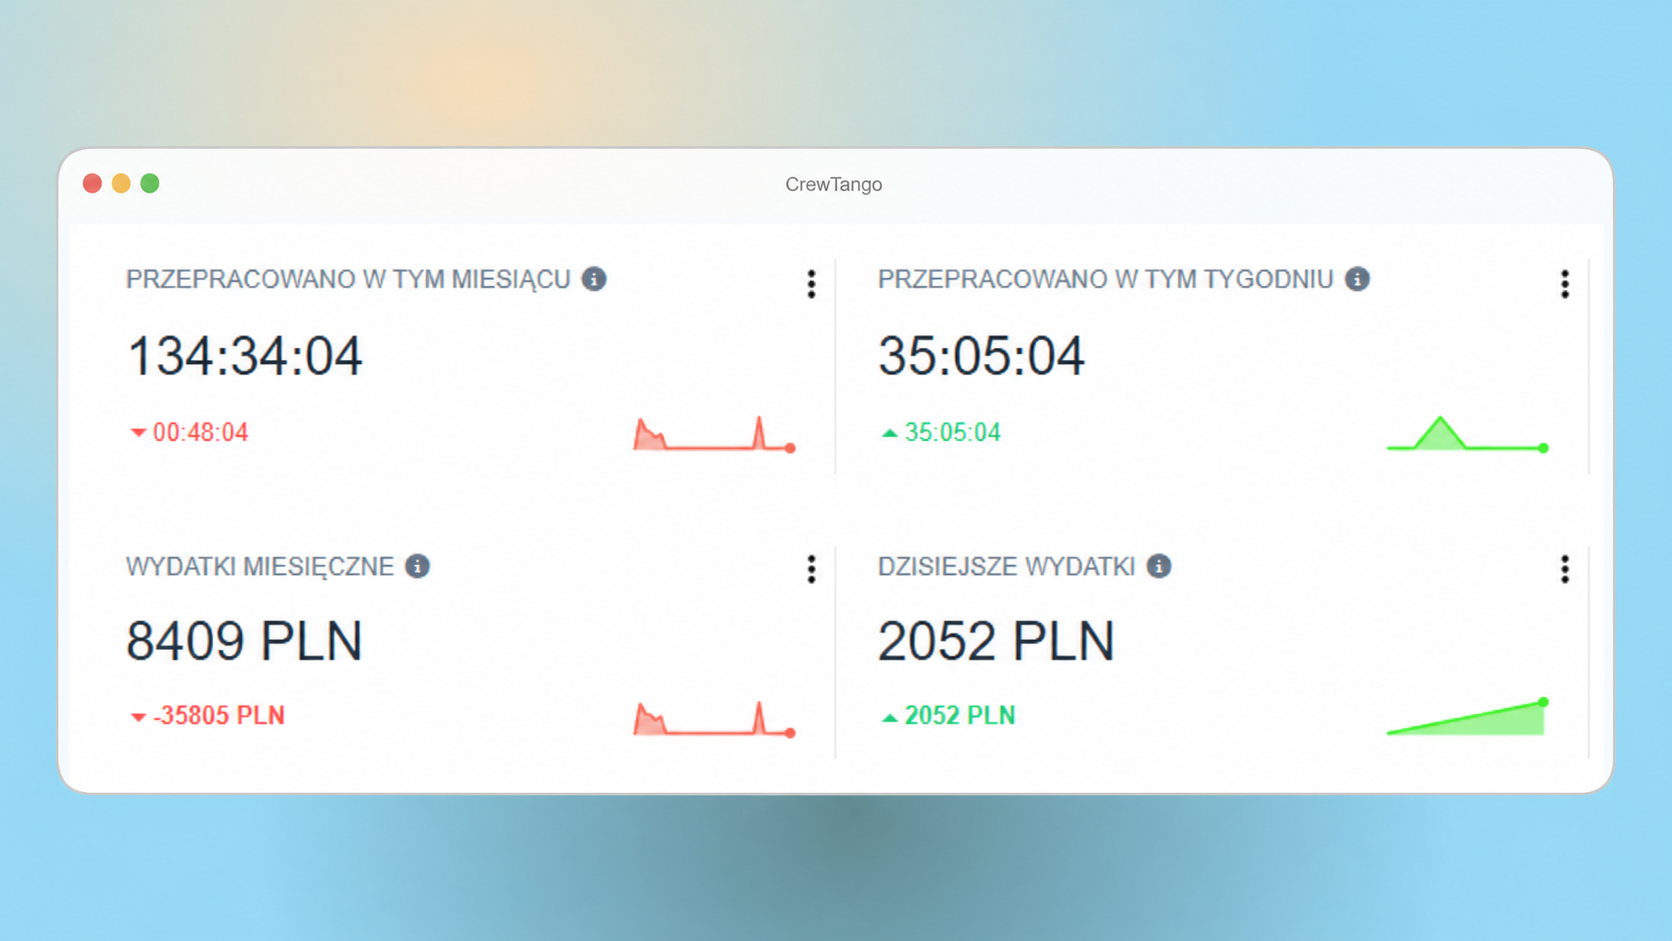
CrewTango project time and cost summary dashboard
AREAS TO MONITOR

What drives project budget usage?

Small deviations add up. See them during delivery, while there is still time to act.

Rework and extra tasks

A small scope change can require additional working hours.

Overtime

Overtime multipliers quickly raise labour costs.

Downtime and waiting

Missing materials, approvals or acceptance checks mean time without results.

Poor estimates

Tasks take longer than planned, but the trend goes unnoticed.

Working across projects

It becomes harder to see how much time the team spent on each project.

No shared summary

Budgets and recorded costs are compared only afterwards.

THE SOLUTION

From working time to budget decisions

Cost control needs consistent, current data. CrewTango connects time with projects and shows what is happening to the budget.

Time assigned to the project

See where working hours go without combining data manually.

Labour and allowance costs

See regular and overtime costs and what drives increases.

Budget and actual work

Compare hour or cost limits with work recorded in the project.

A SIMPLE EXAMPLE

See the remaining time immediately

The project has a 100-hour plan. The team has recorded 82 hours, leaving 18 hours available.

Planned
100 h

agreed time budget

Actual
82 h

recorded working time

Remaining
18 h

remaining for the project

82%

Want to see how your project budget is being used?

Create an account or book a walkthrough of a project report and a simple summary of deviations from the plan.

PRIORITIES

Know which projects use the most time and budget

Reports show working hours and costs based on team rates. Compare actual work with the planned limit more easily.

  • Working time grouped by project
  • Project time or cost budget
  • Weekly and monthly cost views
Project time and budget report
BUDGETS

Budgets and limits that help keep projects on track

Set a time or cost budget. CrewTango compares it with recorded work sessions and team rates.

Time and cost limits

Set a working hour budget and monitor usage over time.

Budget usage

Compare the saved limit with actual hours or costs.

Overtime oversight

See when allowances and multipliers increase costs.

WORKING EXAMPLE

Try the project report

Fictional data: 100 hours planned, 82 recorded. Change the filters and download exactly the rows displayed.

DateTeamHoursCost PLN

Demo data, net amounts. Filters do not change the full project budget.

SUMMARY DASHBOARD

One summary of time, rates and budget

Use project-linked work sessions, saved rates and limits instead of assembling separate spreadsheets.

  • Weekly and monthly summaries
  • Budget compared with actual work
  • Simple project comparisons

Cost and delivery pace trends

Time or cost budget

Project and team comparisons

Organised weekly status meetings

Costs come from actual work sessions

Employees record time against a project. The system connects it with rates, currency, overtime and the time or cost budget.

Hours

time recorded in the project

Rates

cost in the supported currency

Budget

hour or cost limit

Project cost control FAQ

Yes. Reports show time and costs based on rates and allowances.
Yes. See trends and the pace of budget usage over time.
Yes. Overtime and its costs appear as separate components.
Yes. Reports include project, period and person filters.
Yes. Export available summaries to CSV for further processing.

Compare project budgets with actual work

Start with project-linked time, rates and your chosen budget type.