COMPUTER WORK

Team apps, websites and productivity in one view

See which apps and websites your team uses during work. Define productive, neutral and unproductive categories so reports reflect your company's actual rules.

Apps and websites Productivity categories Inactive periods
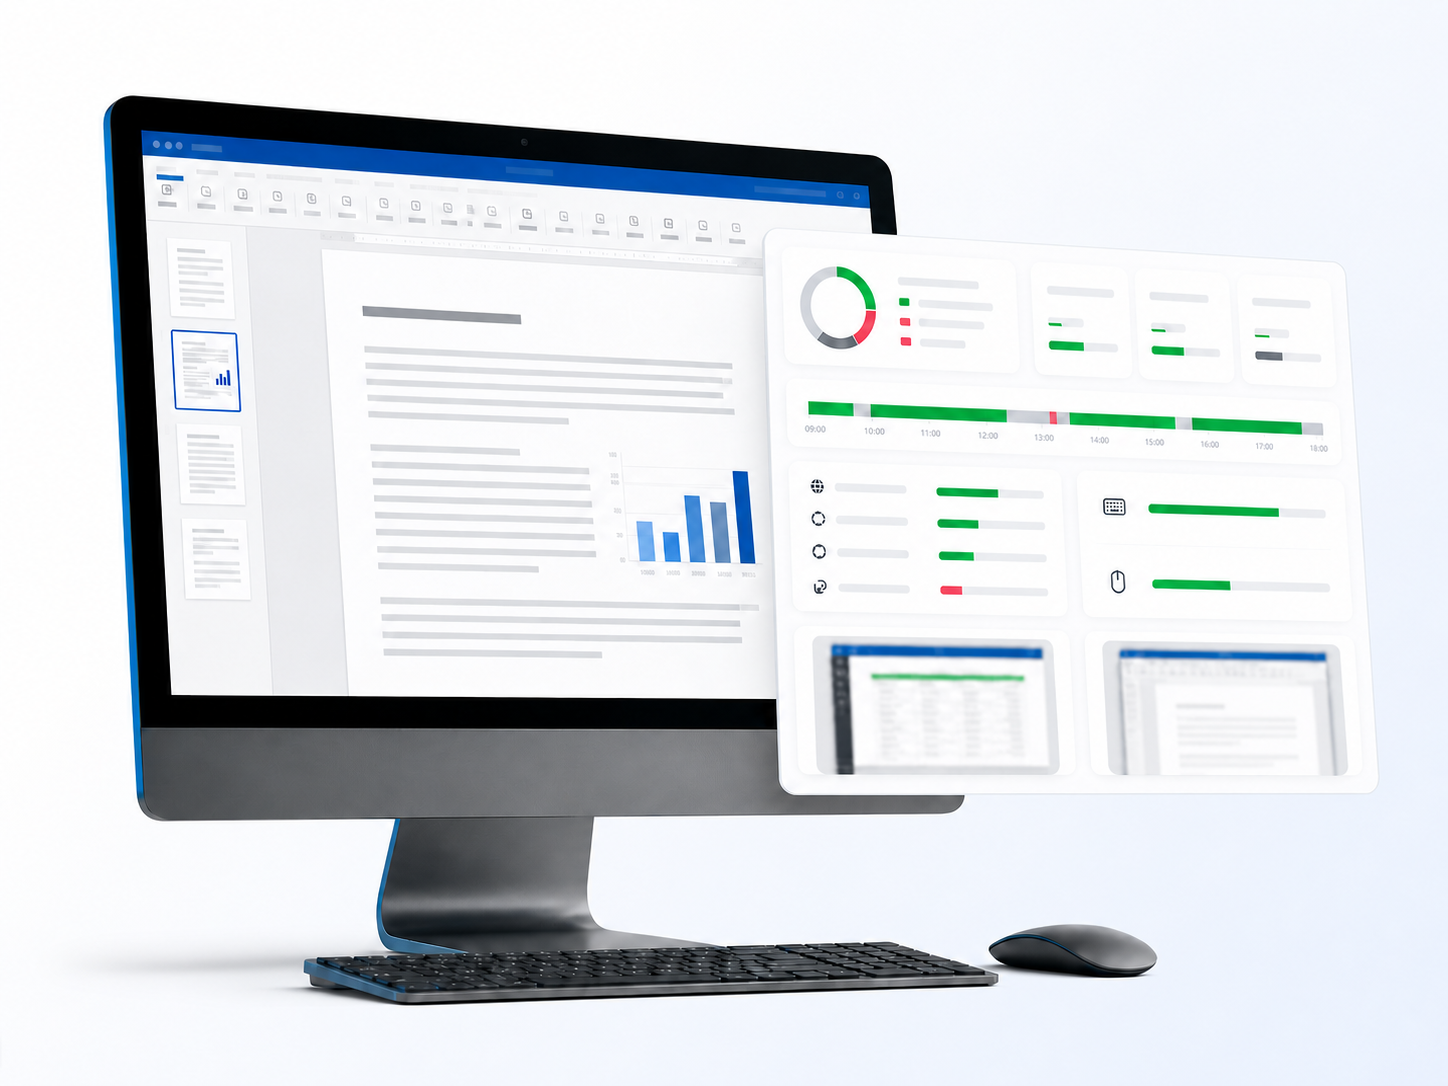
Computer displaying a document alongside productivity, activity and optional screenshot summaries
GREATER VISIBILITY

See how computer time is used

CrewTango connects recorded time with app and website usage. See which tools support work, where downtime occurs and how team working patterns change.

  • Time spent in apps and on websites
  • Inactive periods during recorded work
  • Comparisons across days, weeks and teams

What the computer work report shows

Apps

See time spent using apps needed for everyday work.

Websites

Review websites visited and time spent on them during recorded work.

Productivity categories

Classify apps and websites as productive, neutral or unproductive according to company rules.

Your company decides which data is collected and who can view reports.

OFFICE PRODUCTIVITY

See where computer time goes

Use an overview of apps and websites instead of guesswork. Administrators can classify them as productive, neutral or unproductive, giving reports meaning in your company's context.

  • Apps and websites broken down by time
  • Categories: productive, neutral and unproductive
  • Team comparisons and weekly trends
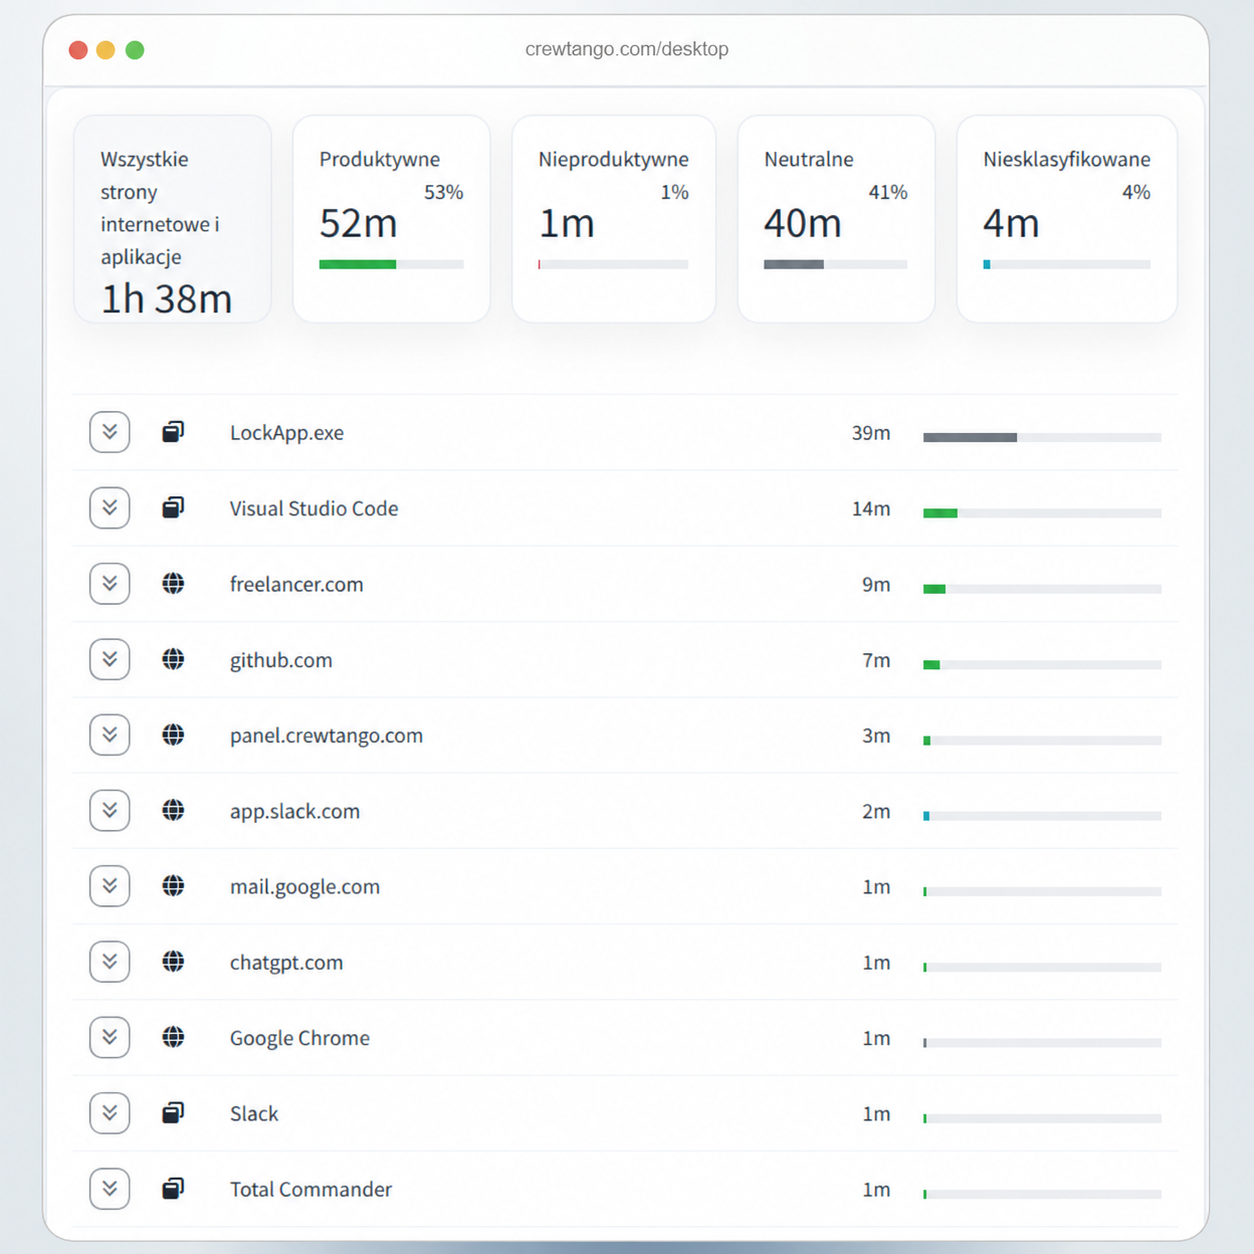
Close-up of the actual apps and websites report
53% productiveBased on company rules
Close-up of a real report
COMPANY RULES

Categories that reflect how your team works

The same app can serve different purposes in different companies. Administrators decide which apps and websites support work, which are neutral and which are unrelated to duties.

Productive

Tools and websites needed for work duties.

Code editor Projects

Neutral

Activities that do not affect the productivity rating.

Email Calendar

Unproductive

Apps and websites unrelated to work under company rules.

Entertainment Video
PERMISSIONS

Everyone sees the information they need

Control access to data and reports. Managers can have a limited scope, such as selected teams or specific dashboards.

  • Roles and data visibility
  • Manager access restricted to selected teams or sections
  • Control over what is measured and reported
SUMMARY DASHBOARD

Key computer work data in one place

The dashboard connects working time with apps, websites and productivity categories. The view depends on permissions.

Time in apps and on websites

One overview of tools used and time spent using them.

Productivity categories

Categories based on company rules.

Inactive periods

Clear context for recorded working time.

CLEAR RULES

Understand how the productivity summary is calculated

Adapt app and website categories to your company's work. Authorised users can see the rules, keeping results connected to the team's context.

  • Categories suited to work duties
  • Visibility based on role and team
  • Clear daily and weekly comparisons
SHARED CONTEXT

What the dashboard actually shows

The dashboard connects recorded working time with apps, websites, activity statistics and optional screenshots, according to settings and permissions.

  • Working time and tracking source
  • Categories for apps and websites used
  • Optional screenshots and activity statistics

Productivity FAQ

No. These features are optional. Enable selected data sources according to company policy and user roles.
Yes. Categorise apps and websites so reports reflect the way you actually work.
Roles control access. Managers can see selected teams or sections only.
Inactive periods appear alongside recorded working time. They help distinguish app and website usage from periods when the computer recorded no activity.
These are separate, related features. GPS is mainly for field teams, photos can be attached to tasks, and documents can be signed on a phone or through a secure link.

See how your team uses computer time

Create an account and review apps, websites and productivity categories in one dashboard.