Narrow the scope
Select a project, dates and a user. Focus on the data that answers your question.
Bring team hours, labour costs and your project budget together. See where the numbers come from — and which tasks need attention.
From total hours to an individual entry.
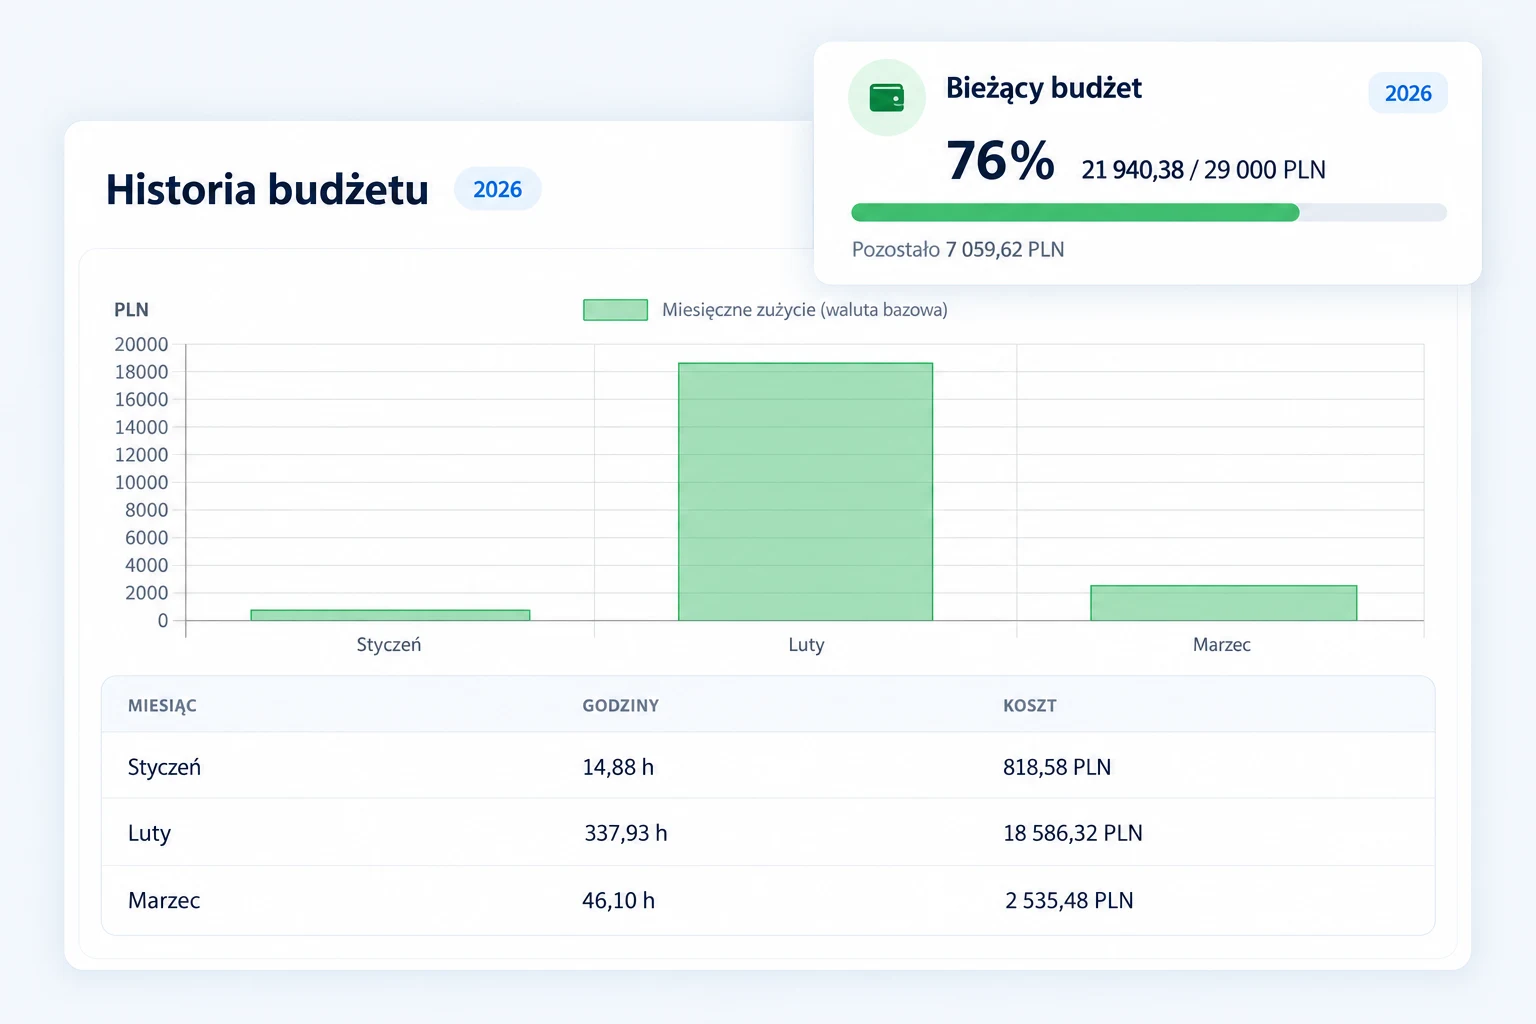
Labour costs in the context of your project limit.
Overdue tasks and entries to review.
See budget usage and cost history month by month. Know how much labour cost has been recorded in the project and how much of the limit it has used.
Choose a limit that suits the way you run your project.
Keep a budget without a reset, or renew it weekly or monthly.
Review a month, then open the time entries behind its total.
Each view has its own scope. The time report covers the selected dates, while the current budget follows the configured budget period.
Select a period and a person. Review team hours, session counts and labour costs. When you need more detail, check the start, end and source of an individual entry.
One project. A complete view of working time.
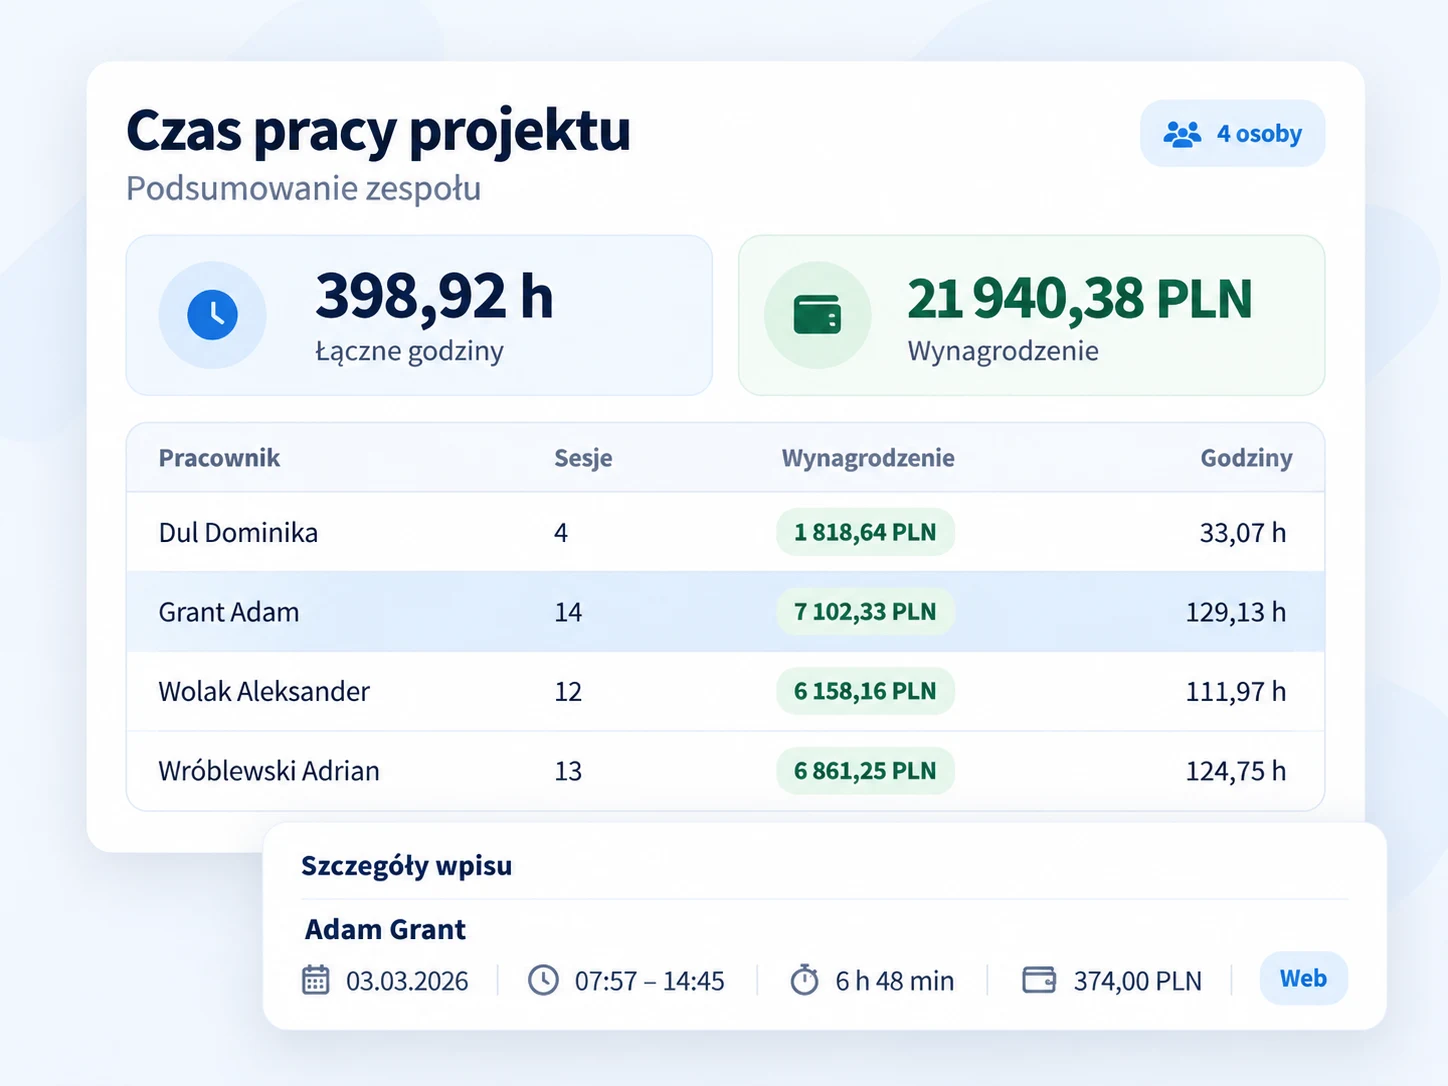
Scroll the image to read the data and entry details.
Select a project, dates and a user. Focus on the data that answers your question.
Compare each person’s hours, sessions and labour costs over the same period.
Open an entry’s details to verify its duration, recording source and calculated amount.
2 of 2 open tasks · need review
0 open · 0 long · 0 unverified sessions
The report helps you find overdue tasks and entries to verify. Go from the summary to the list to check the details and decide what to do next.
Overdue, due soon or open for a long time — broken down by priority.
Open sessions, work periods longer than 12 hours and sessions that need verification.
Pass the summary on for payment processing or further analysis. Keep the selected context and share the data with the people who need it.
Export budget history or period analysis. Continue working with the numbers in a spreadsheet.
Use PDF in views that support it. Available export formats depend on the selected report.
The information a user can see and export depends on their assigned permissions.
Reports connect to your team’s everyday work.
Key information about date ranges, budgets and working with reports.
Reports include working hours, session counts, calculated earnings, budget usage and task information. Within a project, you can go from the summary to individual time entries and the task list.
Yes. In a project, you can select dates and a user. The task view also provides filters for status, priority and risk.
Period analysis uses the dates you select. The current budget follows its configured reset cycle, while budget history shows a fixed window of the last 12 months. This lets you review a selected period separately from the project’s remaining budget.
You can set a cost or hours budget, or run the project without a limit. A budget can have no reset or renew weekly or monthly.
These are amounts calculated from recorded work and the configured payment settings. They help you track how your team’s work uses the budget. This summary alone is not a complete cost statement or a calculation of project profit margin.
Budget history and period analysis provide CSV export. Other reports may offer CSV and PDF, depending on the view and the user’s permissions.
No. Access to reports, team data and costs depends on the roles and permissions configured in your company.
Bring working time, budgets and tasks together. See what your team’s data tells you.